7 min read

All throughout 2011, the Cassini spacecraft collected science at a torrid pace. Mission scientists dished up exciting results all year long, from scrutinizing a huge new storm on Saturn, to discovering salty particles in Enceladus’ plumes, to studying Saturn’s rings with radio science experiments.
Those Cassini scientists took a quick breath to compile their list of Top 10 Science Highlights. See what in 2011 stood out to them
- The Great Northern Storm on Saturn
- Spring Rain on Titan
- Discovery of Salty Particles in Enceladus' Plume
- Ripples in the Rings: A Record of Past Impacts
- Reversal of North-south SKR Periodicities
- Discovery of the Auroral Footprint of Enceladus
- The Falling Haze Layer on Titan
- First SAR images of Enceladus
- Helene the Ice Queen
- Bursty F-ring Activity

NASA's Cassini spacecraft captures a composite near-true-color view of the huge storm churning through the atmosphere in Saturn's northern hemisphere.
- This is Saturn’s biggest, most intense storm since 1990.
- Cassini’s radio and plasma wave science (RPWS) instrument detected the first signs of lightning on Dec. 5, 2010. RPWS data show the lightning flash rate as more than 10 times per second.
- Images from amateur astronomers and Cassini were also obtained the same day.
- The storm grew rapidly, wrapping around the planet by late January 2011.
- The storm's active convecting phase ended in late June 2011, but the turbulent clouds it created linger in the atmosphere today.
Also see:
- Cassini and Telescope See Violent Saturn Storm
- Cassini Spacecraft Captures Images and Sounds of Big Saturn Storm
- Cassini Chronicles the Life and Times of Saturn's Giant Storm

This series of images from NASA's Cassini spacecraft shows changes on the surface of Saturn's moon Titan, as the transition to northern spring brings methane rains to the moon's equatorial latitudes.
- A huge cloud observed on Titan in September 2010 was quickly followed by extensive changes on the surface. Left behind was a visible change greater than 200,000 square miles (about 500,000 square kilometers), roughly the combined area of Arizona and Utah.
- In these images bright features are methane clouds, shades of gray are surface features.
- The best explanation for the changes is widespread methane rainfall from the storm making the surface wet, perhaps even flooding it in some places.
- The observation of recent rain suggests that the climate here is similar to the southwestern U.S., where infrequent rain carves washes and riverbeds.
- Titan’s weather is changing with the seasons, now early northern spring (around April on the northern hemisphere on Earth), and storms have become more common at low latitudes.
- Titan’s weather is changing with the seasons, now early northern spring (around April on the northern hemisphere on Earth), and storms have become more common at low latitudes.
Also see:
- Cassini Sees Seasonal Rains Transform Titan's Surface
- Titan Storms -- Image Gallery

Darker blue indicates more salt-rich grains in this illustration of Enceladus' plume
- Cassini’s cosmic dust analyzer (CDA) and ultraviolet imaging spectrometer (UVIS) have made an exciting collaborative discovery: The vast majority of the grains in the plume have an ocean-like composition.
- There are two sources of ice grains from Enceladus’ south pole:
- High speed gas jets, seen in UVIS data, propel mostly small pure ice (salt-poor) grains far out into space forming the E ring
- The more diffuse plume produces bigger, mostly salt-rich ice grains; these heavier grains are primarily found closer to the surface, deeper in the plume.
- These results are the strongest evidence to date for liquid water in Enceladus’ interior: as Cassini gets closer to the sources, CDA detects more salt-rich grains.
Also see:
Cassini Captures Ocean-like Spray at Saturn Moon

This graphic shows in a series of three images how Saturn's rings, after they became tilted relative to Saturn's equatorial plane, would have transformed into a corrugated ring.
Imaging science systems (ISS) images and radio science subsystem (RSS) occultations directly detect "ripples" in the C ring, probably caused by impacts of debris clouds onto the rings associated with, e.g., SL-9 (comet Shoemaker-Levy 9) type events. These observations can be dated very well using the wavelength of the ripple, and point to three such events over the past 600 years.
Also see:
Forensic Sleuthing Ties Ring Ripples to Impacts

This spectrogram and video show a changing pattern of radio waves from Saturn known as Saturn Kilometric Radiation, as detected by NASA's Cassini spacecraft.
- Recent data from the RPWS instrument show that the variation in radio waves controlled by the planet's rotation is different in the northern and southern hemispheres. Moreover, the northern and southern rotational variations also appear to change with the Saturnian seasons and the hemispheres actually swapped rates not long after equinox.
- Saturn emits radio waves known as Saturn Kilometric Radiation (SKR). These radio waves vary with each rotation of the planet. To Cassini, the waves sound like bursts of a spinning air raid siren. This kind of radio wave pattern had been previously used at Jupiter to measure that planet’s rotation rate. However, measuring the exact rotation rate of Saturn turned out to be much more complicated.
- The data shown here cover a period from 2004 to late 2010. Saturn's equinox, when the sun shone directly over the planet's equator, occurred in August 2009. That marked the beginning of spring in Saturn's northern hemisphere. The crossover of the radio wave variations occurred around March 2010, seven months after equinox
Also see:
Cassini Finds Saturn Sends Mixed Signals

This artist's concept shows a glowing patch of ultraviolet light near Saturn's north pole that occurs at the 'footprint' of the magnetic connection between Saturn and its moon Enceladus.
- Enceladus is magnetically “connected” to the polar region of Saturn and leaves a footprint.
- In far-ultraviolet images from Cassini, the Saturn aurorae (“northern lights”) glow in an oval shape around the north pole.
- Enceladus’ footprint appears in some images as a spot just outside the auroral oval.
- The auroral footprint is the spot where energetic electrons dive into the planet's atmosphere, following magnetic field lines that arc between the planet's north and south polar regions.
Also see:
- Cassini Sees Saturn Electric Link with Enceladus
- Saturn Electric Link with Enceladus -- Image Gallery

The change in Titan's haze layer is illustrated in this figure, derived from data obtained by NASA's Cassini spacecraft.
- Saturn’s moon Titan has a massive atmosphere laden with layers of photochemical haze/smog.
- Cassini cameras have measured a dramatic change in the haze vertical structure.
- One of the atmospheric layers is a persistent ‘detached’ layer that has fallen in altitude from over 310 miles to only 240 miles (about 500 kilometers to only 380 kilometers) between 2006 and 2010 - and nearly matches the Voyager measured altitude of 223 miles (357 kilometers) taken one Titan year earlier, in 1981.
- These observations indicate a clock-like seasonal cycle in the altitude of Titan’s smog.
Also see:
On Titan, the Sky is Falling!

This image shows grooves in the southern part of Saturn's moon Enceladus. The image was created using synthetic-aperture radar (SAR) data acquired by NASA's Cassini spacecraft on Nov. 6, 2011.
- These are the first-ever Enceladus images taken with Cassini's synthetic-aperture radar (SAR).
- Images reveal new details of some of the grooves in the moon's south polar region and unexpected textures in the ice.
- These images, obtained on Nov. 6, 2011, are the highest-resolution images of this region obtained so far.
Also see:
What's That Sparkle in Cassini's Eye?

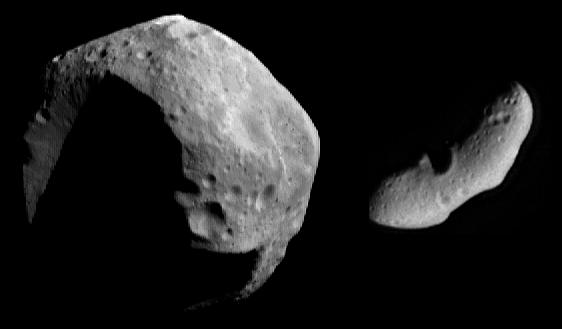
NASA's Cassini spacecraft obtained this unprocessed image of Saturn's moon Helene on June 18, 2011.
- Helene (just 20 miles, or 32 kilometers, in diameter) is a co-orbital moon of Saturn’s moon, Dione - it shares an orbit with that much larger moon.
- Recent views by Cassini reveal a surface that appears to have been extensively modified.
- Helene exhibits bizarre, unexplained surface features including flows or tectonic patterns, and very few craters.
- Studying Helene and other co-orbitals (moons that share a common orbit around Saturn) can help to illuminate how E-ring grains interact with the surfaces of the moons.
Also see:
Cassini Captures Ice Queen Helene

A bright clump of material within Saturn's tenuous F ring stands out near the center top of this Cassini spacecraft image.
- Even though the last closest approach of Prometheus to the F ring strands was in December 2009, the resulting stirring of embedded moonlets might take a while to make its presence felt because collision probabilities with the F ring core are low.
- Huge clumps were seen in 1995-1996, several years after the prior Prometheus closest approach, and the F ring now is two times brighter than during the Voyager flyby.
- The very large burst (right) was seen October 2010. It must have formed very soon before the image, because it had not spread appreciably in angle.
- Note the “fan” of diagonal dark lanes centered on the burst, which indicates the presence of a massive embedded object on a more eccentric orbit.
- Also note how disturbed the nearby F ring core - normally so narrow – appears.
- By analogy with 1992-1996, the 2013-2016 time frame may be extremely active for the F ring.
Share
Details
Last Updated
Jan 24, 2024
Editor
NASA Science Editorial Team