2 min read
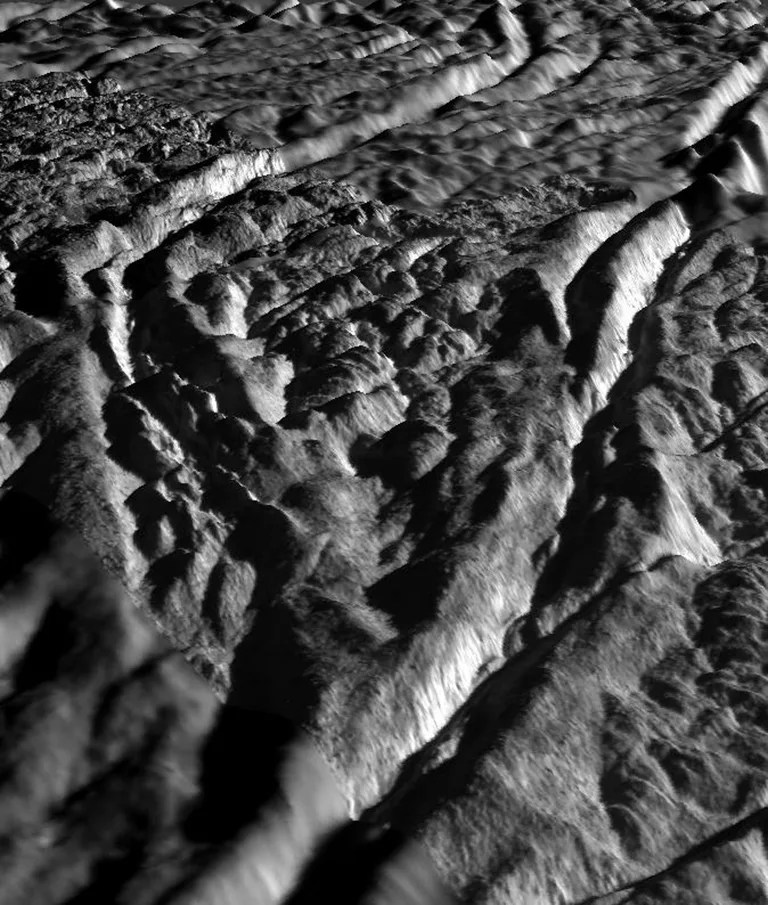
E-8: Cassini Returns to the Tiger Stripes
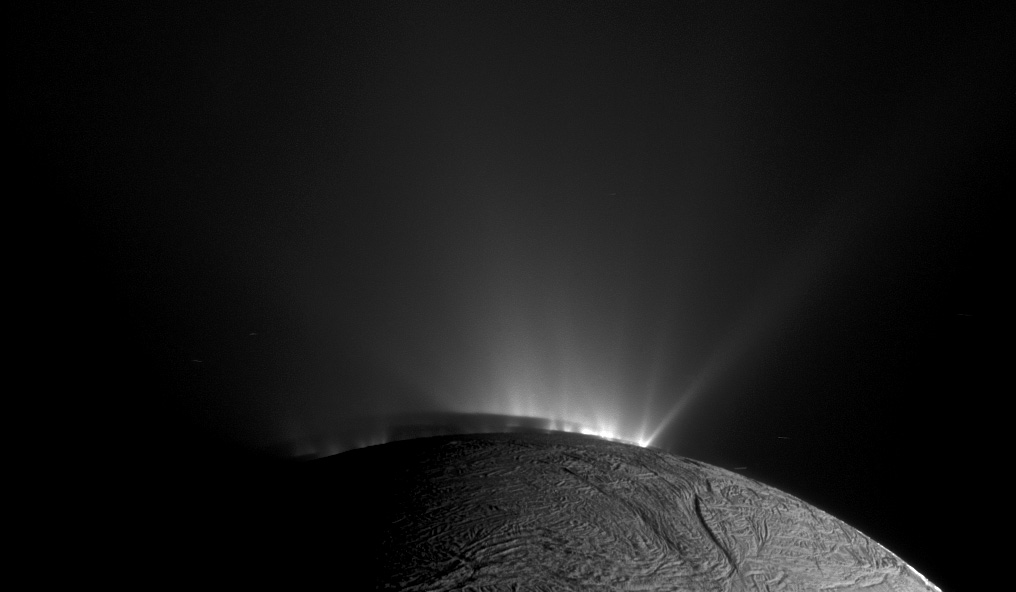
Just under three weeks after the Enceladus 7 flyby, Cassini once again flew past Enceladus, this time with a very different geometry, approaching within 1,600 kilometers of the surface. The Enceladus 8 (also known as "E8") closest approach occurred Nov. 21, 2009 Spacecraft Event Time (SCET), at a speed of 7.7 kilometers per second at 82 degrees south latitude.
The spacecraft was under thruster control during the flyby to allow for precise tracking of surface features.
The Visible and Infrared Mapping Spectrometer (VIMS) observed Enceladus as the moon emerged from eclipse, followed by a Composit Infrared Spectrometer (CIRS) fast raster scan of Enceladus' night side. The Imaging Science Subsystem (ISS) then took over for high-resolution plume observations obtaining a clear filter mosaic of terrain on the leading hemisphere, providing the best-resolution mosaic so far of that hemisphere. This data can be combined with earlier images of the same region at different geometries to create high-resolution topographic maps, and will be used to look for possible temporal variations in the morphology of the tiger stripes.
CIRS had prime pointing control during closest approach for a high resolution scan of Baghdad Sulcus ¬- one of the tiger stripe features - tracking along the fissure in the south polar region to examine plume sources and producing the highest-ever-resolution contiguous thermal map of this region.
ISS and VIMS then mapped the sunlit surface of Enceladus on departure. The Ultraviolet Imaging Spectrograph (UVIS) performed a long stare for a tenuous atmosphere search, which will provide data to associate plume activity with the quantity of volatiles near Enceladus. Over the following downlink of data, Radio Science (RSS) performed gravity science to better determine Enceladus' mass.
Date
Nov. 12, 2009
Altitude
998 miles (1,606 km)
Speed
17,200 mph (7.7 km/sec)

